
Imagine you are manufacturing a plastic injection-molded component with a visible surface that must be aesthetically pleasing. The design looks good, the mold has been fabricated, and production has started.
But suddenly you notice a problem. Some parts have visible flow lines, uneven surface appearance, or other cosmetic defects, while others look perfectly acceptable.
The production team adjusts the molding parameters. Things improve for a while, but then the defects return. What is going wrong?
The natural reaction is to look for one cause. Maybe the injection molding machine needs adjusting. Perhaps the mold was poorly designed. Or maybe the operators are not following the correct process. However, the real problem may be more complicated and requires manufacturing root cause analysis to figure out.
One Defect, Many Possible Causes
Let’s consider what might be contributing to the inconsistent appearance of our molded component.
- Product design: The part geometry might create a difficult flow path for the molten plastic. Thin walls, abrupt thickness transitions, or long flow distances can make consistent filling challenging.
- Mold design: The position or size of the gate may not be ideal. Once the tool has been fabricated, options for moving the gate can be limited or expensive.
- Injection molding machine: The machine might not provide sufficiently precise control of injection speed or pressure, or the process may require operating close to its practical limits.
- Materials: Variations in resin batches, moisture content, or material properties can affect how the plastic flows and how the surface looks.
- Manufacturing process: Small changes in melt temperature, mold temperature, injection speed, or holding pressure might significantly affect the results.
- Maintenance: Cooling channels might become partially obstructed, heaters may deteriorate, or other equipment conditions might change over time.
- Inspection and measurement: If cosmetic acceptance criteria are subjective, two inspectors may disagree. Lighting conditions and a lack of approved reference samples can make matters worse.
Notice something important here? Any one of these factors might contribute to the defect. Several might also interact.
Using a Fishbone Diagram to See the Bigger Picture
A useful tool for investigating this situation is a fishbone diagram, also known as an Ishikawa or cause-and-effect diagram.
It helps manufacturing teams organize possible causes before investigating them systematically.
For our injection molding example, the diagram might look like this:
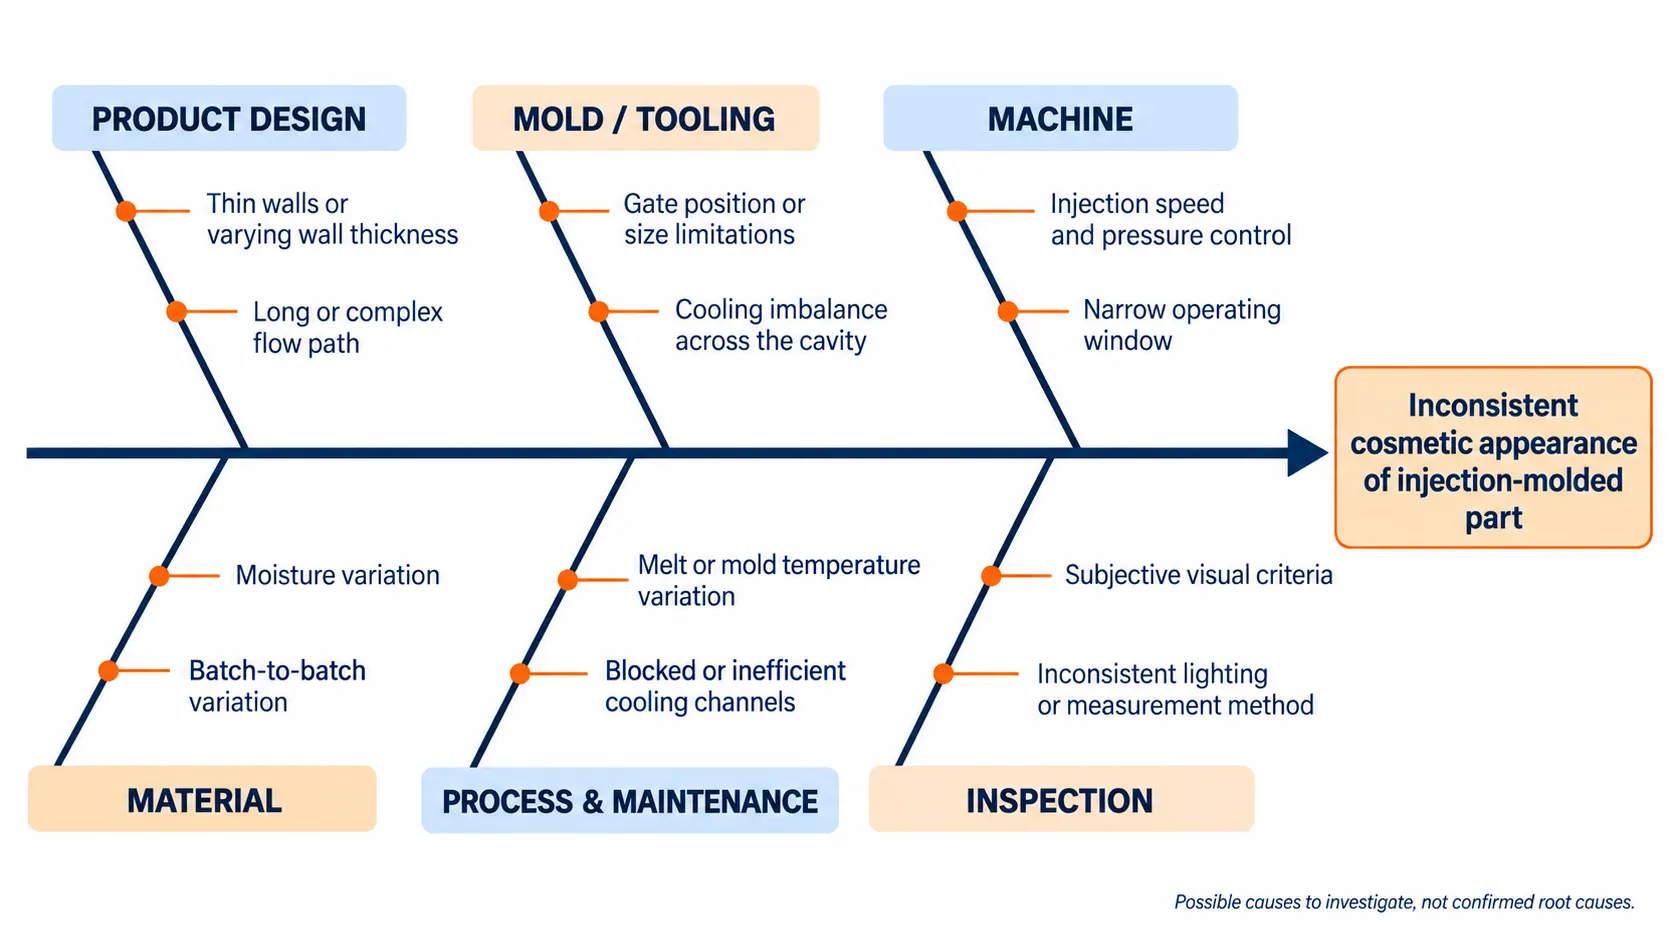
Example: potential contributors to inconsistent cosmetic appearance. These are hypotheses to investigate, not proven root causes.
And, as you can imagine, the fishbone could keep growing. Each branch might have several more sub-causes. But the objective is not to create the longest possible list. The objective is to identify the most plausible causes, gather evidence, and determine which ones truly are contributing to the issue.
For an example of how a fishbone fits into structured corrective action, see QualityInspection.org’s guide to corrective action plans after a failed inspection.
How to Use a Fishbone Diagram in Manufacturing
A fishbone diagram is relatively simple to create. The challenge is using it to guide an effective investigation.
Here is how I would approach it.
- Define the problem precisely. Avoid vague descriptions such as “poor molding quality.” Instead, specify the defect, where it occurs, and how frequently. For example, “visible flow marks on 15% of molded housings.”
- Bring the right people together. Include representatives from product design, tooling, production, maintenance, and quality. Each person sees the problem from a different perspective, and their combined knowledge helps build a more complete picture.
- Brainstorm possible causes. Work through the diagram’s branches and ask what might contribute to the defect. Don’t jump to conclusions or dismiss ideas too early. At this stage, the objective is to identify possibilities, not assign blame.
- Prioritize the most likely causes. A fishbone diagram can keep growing, but investigating every possible cause is rarely practical. Use production records, inspection results, engineering knowledge, and observed patterns to narrow the list.
- Test your hypotheses. This is where the real root cause analysis begins. You might run controlled molding trials, check material moisture levels, review tooling conditions, or compare results across different machines and production shifts. Change one factor at a time where practical, or use a structured experiment when multiple variables interact.
- Verify the corrective action. Once you believe you have identified the cause, implement the necessary changes and check whether the improvement holds across normal production conditions. Update the relevant process controls and documentation to prevent the problem from returning.
The important distinction is that a fishbone diagram helps you organize potential causes. It does not prove which ones are actually responsible.
That requires evidence.
Finding the Root Cause Requires Looking at the Whole System
Suppose the production team discovers that increasing the injection pressure reduces the cosmetic defects.
Problem solved? Not necessarily.
Perhaps the pressure adjustment is simply compensating for a poorly positioned gate. The process might now work, but only within a very narrow operating window. A small change in resin properties or mold temperature could bring the defects back.
This is why an effective corrective action should not simply eliminate a defect under today’s conditions. It should make the process sufficiently robust to handle the normal variations encountered during production.
Sometimes this requires changes to tooling or product design rather than further adjustments to machine settings, and sometimes there is more than one contributing cause.
The Earlier You Think About the System, the Better
Ideally, these interactions should be considered before mass production begins.
In fact, plastic injection molding is a good example of why manufacturing needs to be viewed as a complete system.
Consider the illustration below. Producing consistent, high-quality molded parts depends on much more than the molding machine or the tool itself.
The product design, tooling, materials, manufacturing process, people, and supporting infrastructure all have a role to play. Even business considerations, such as cost targets and production capacity, influence the decisions made throughout the process.
Each layer affects the others. A design decision can make tooling more complicated. Material selection can affect the processing window. Poor maintenance can undermine a previously stable process. And unrealistic cost or delivery targets may put additional pressure on manufacturing decisions.
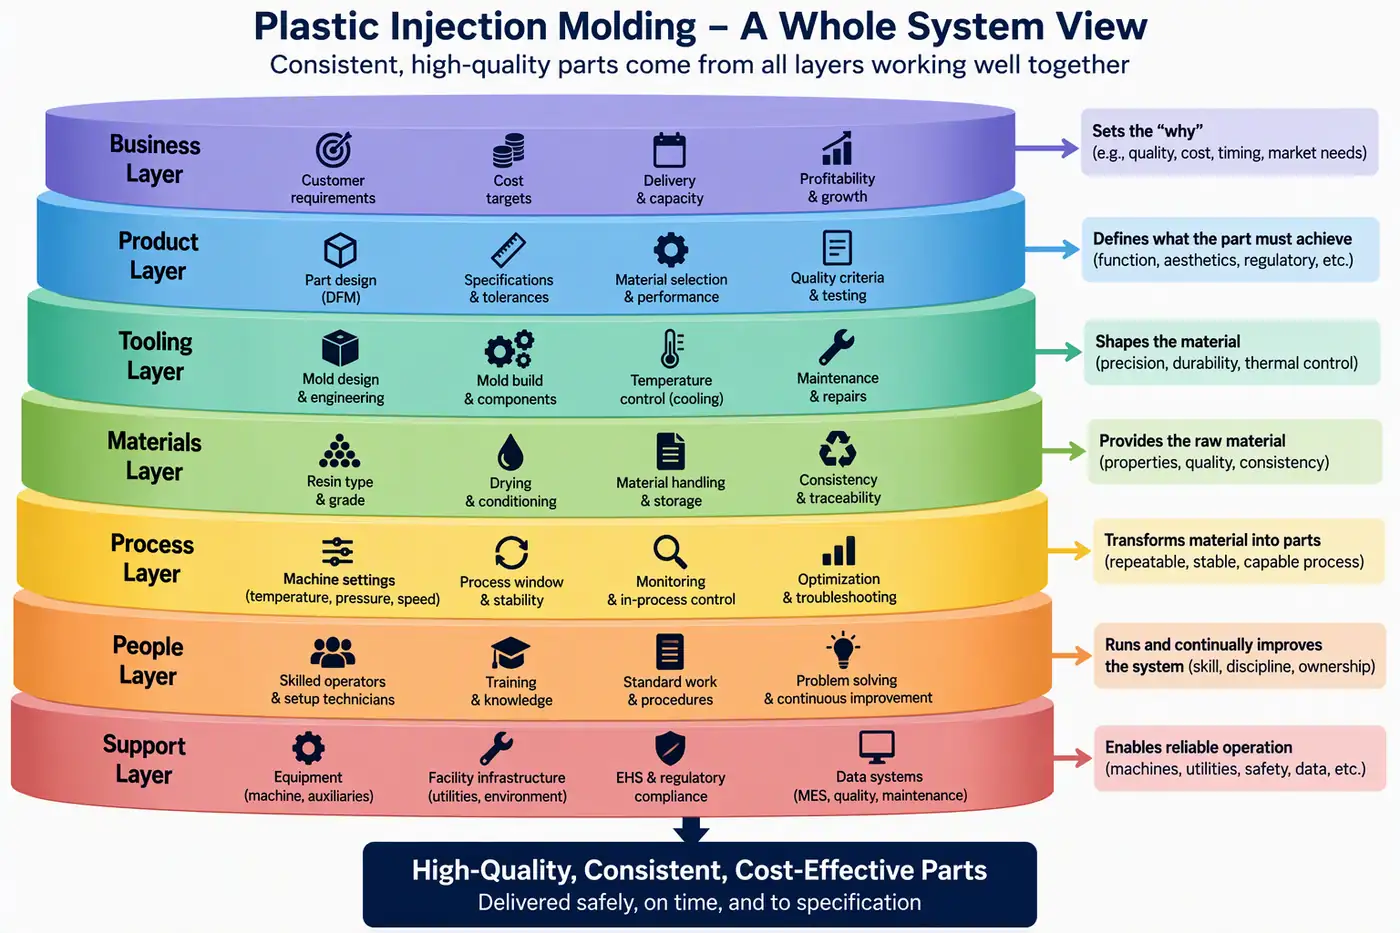
Figure: A whole-system view of plastic injection molding, illustrating how business requirements, product design, tooling, materials, processes, people, and supporting systems contribute to consistent manufacturing outcomes.
This is why a thorough design for manufacturing (DFM) review is so valuable. It can identify potentially troublesome geometry and other manufacturing constraints before they become expensive production problems. (For a deeper look at typical defects, see QualityInspection.org’s guide to nine plastic injection molding defects).
Tooling reviews can address gating and cooling. Process validation can help establish whether the product can be manufactured consistently within a sufficiently robust operating window.
At Agilian, we bring product engineering, tooling, manufacturing, and quality considerations together during new product introduction, rather than treating them as completely separate activities.
The lesson applies well beyond plastic injection molding. Electronic assemblies, mechanical products, and complete electromechanical devices can all experience problems arising from interactions between different parts of the manufacturing system.
When a manufacturing problem keeps returning, don’t just ask which machine, person, or process is responsible. Ask how the different parts of the manufacturing system interact.
That is often where the real answer lies.
Acknowledgment: This article was inspired by a LinkedIn post from Declan Coyle highlighting the importance of looking at manufacturing problems as a whole system. His example prompted me to explore how fishbone diagrams can help manufacturing teams investigate potential root causes.